2017 Prediction
Earlier this year, Business News Australia reported that, “(b)ack in April last year, North said the All Ords would hit 6,000 points by the end of 2017. On 7th November North was proven right when the All Ords finally reached 6,000 points it had been nearly 10 years since it reached this level.”
So why did I make the prediction that the All Ords could be poised to reach 6,000 points by 2017 end?![]()
- Stellar round of half-yearly company earnings results
- Increasing dividend payments
- Rise in commodity prices over past 12 months
- Sustainability of company earnings
- Stable commodity prices Lower exchange rate
- Low cash rate of 1.5 to 2 per cent

Booms & Busts Throughout History
- The Tulip Craze, Holland, 1634-1637
- The South Sea Bubble, United Kingdom, 1711
- The Florida Real Estate Craze, Florida, 1926
- The Great Depression, United States, October 21, 24 and 29, 1929
- The Crash of 1987, United States, October 19, 1987
- The Asian Crisis, Southeast Asia, primarily Japan, 1989 – Ongoing
- The Dotcom Crash, Silicon Valley, March 11, 2000 to October 9, 2002
- Global Financial Crisis, World Wide, 2007 – 2009
- Chinese Stockmarket Crash, China, 2015 – 2016

Australian sharemarket history since 1900

In the 142-year history of the Australian sharemarket, after every ‘Boom’ there has been an inevitable ‘Bust’. Some of these ‘Busts’, like in 1987, have seen the market decline by up to 50% in a very short timeframe.
In November 2007, the decline was also 50% from the peak (6,800) of the market, however the bottom of the market wasn’t reached until much later in March 2009 (3,109).
The one thing that history does tell us is that after every ‘Boom’ and ‘Bust’ the market has always worked its way back to its previous high and then surpassed it.
This has occurred over every cycle except the one we are in at the moment. It has now been over 11 years since the current all-time market peak was achieved.
The inevitable question to ask is will we reach the previous high of 6,800?
How much can we really bear?
- The average decline of each bear market since 1969 was 37% with our very own All Ordinaries Index falling 53%, from its record high in 2007
- The worst bear market was between January 1973 and September 1974, where the index declined 55%
- Once a bear market ended, it took an average of 33 months to exceed the previous market high
- The average sharemarket return for the three years directly following the end of a bear market was 62%, or 17.4% per year
- The average sharemarket return in the six months directly following the end of a bear market was 28%

2018 Prediction
For 2018, I predicted that by the end of the 2018 calendar year the market will return to the all-time high of 6,800 points. And up until 30th August, this prediction was on-trend.
- All Ords began the year at 6,167 and peaked at 6,481 on 30th August
- Ten year high in January as commodities surge, overseas markets boost the Australian market, as the Dow pushes past 25,000
- A lower Australian dollar and an expectation that interest rates will stay low into the future, and a lift from the energy sector, has seen a decent rise towards the end of April
- Political uncertainty in Europe sends Australian stocks diving towards the end of May amid a global sell off as Italy’s economic future was thrown into doubt
- June sees a fresh 10 year high boosted by the banks, as the “peak fear” from the Banking Royal Commission is in its final stages with the idea that further terrible news from the Commission will come
- August proves a positive month for Wall Street, paced by the technology heavy benchmark, the Nasdaq, which helps to boost the ASX

It was all going so well until…
- Political turmoil in Canberra sees the All Ords lose $30 billion in one week to 23rd August
- Poor sessions on Wall Street where US shares sold off heavily ahead of the start of the earnings season, and investors locking in gains sees the ASX drop alarmingly through October and November

6,800? Why not?
- Financial markets can often be in a daily tailspin depending on the receipt of good or bad news.
- The sharemarket is largely driven by the changes in market sentiment.
- Companies can often be challenged to maintain earnings in the various stages of the investment cycle.
“Right now, our stock market, as assessed by the S&P/ASX 200 index, is at 5728 but if there’d been no Royal Commission, ScoMo hadn’t picked on energy companies and aged care businesses, our index would’ve been about 6000. And if President Trump hadn’t gone long tariffs and a trade war with China, I reckon our index would be closer to 7000!”
Peter Switzer, 28th November 2018
Top 50 stocks can be such a drag…

The Big Four Banks 2018

Outstanding small caps
Small companies that have outperformed the Index & Top 50
– Small companies
– Index & Top 50

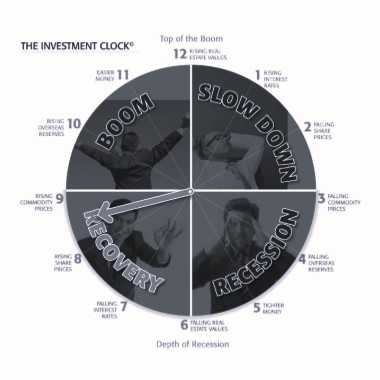
So… What time is it?
Are we at the end of a bull market & the beginning of a bear market?
Or is there still one last leg to the bull market?

BULL?
“Over the last decade, central banks have pumped an unprecedented level of liquidity into the economic system, lowering interest rates to record levels and driving asset valuations to extremes. The recent stock market rout has wiped out the 2018 calendar year gains in the US, while China’s equity market has fallen by nearly 30% from its peak earlier this year and Australia has entered a technical correction. I believe we are in the final stages of the longest US bull market in history. What concerns me most is that all bear markets are extremely painful.”
Geoff Wilson, WAM Capital Limited
BEAR?
“Trading activity inside the Australian share market very much resembles that of a genuine bear market. Bad news is being punished without recourse. Good news might trigger a share price rally, but that subsequently becomes a source for taking profits and raising more cash. No news can mean anything, but most likely the stock is being sold off on flimsy correlations and spurious projections.”
Rudi Filapek-Vandyck, FNArena
State of the US Economy
- Unemployment rate – 3.7% October 2018 – 49 year low
- Federal Reserve interest rate – 2-2.25% – 8th rate rise since 2015
- Corporate Profits up 2.1% to an all-time high of USD $2,007.5 billion in 2nd quarter 2018
- Combined Federal and State corporate tax rate fell from almost 40%, the highest in the developed world, to 24.9% – American businesses are now competitive again
- Dow Jones reached its highest peak of 26,828.39 on 31st October 2018

Why we should be cautiously optimistic for 2019
- Company earnings and profits continue to improve
- Unemployment rate is down to 5% – lowest since January 2013
- Inflation Rate is steady – 1.9%
- Interest Rates to remain low into 2019 – been at record low of 1.5% for over 2 years
- All Ordinaries Index set to rise back above 6,000
- First Budget Surplus in 10 years to be delivered in April 2019
Words of Wisdom in a Bull Market
“While good profits can be generated from acquiring shares before they list on the sharemarket, it should be remembered that the sharemarket is a volatile and uncertain beast. Booms come and investors can accumulate great wealth. Booms disappear and can quickly wipe-out investment value. Keep your head while all those around you lose theirs.”
Rod North