A simple guide to understanding economic and market cycles
The Australian sharemarket is putting in a consolidating performance so far in 2017, with the All Ordinaries Index sitting at 5,975 points at the time of writing. The sharemarket has a 52 week high of 5,880 with the US Dow Jones recently breaking through an all time record high of 21,000. There is much more anecdotal evidence in Australia as to why the Index now has the best chance to rise above 6,000 over the course of 2017 and then head towards and above the previous all time market high of November 2007 when it reached 6,800.
In the 142 year history (1875) of the Australian sharemarket, after every ‘Boom’ there has been an inevitable ‘Bust’. Some of these ‘Busts’, like in 1987, have seen the market decline by up to 50% in a very short timeframe. In November 2007, the decline was also 50% from the peak (6,800) of the market however the bottom of the market wasn’t reached until much later in March 2009 (3,109).
The one thing that history does tell us is that after every ‘Boom’ and ‘Bust’ the market has always worked its way back to its previous high and then surpassed it. This has occurred over every cycle except the one we are in at the moment. In November 2017, it will be 10 years since the current all time market peak was achieved. The inevitable question to ask is will we reach the previous high of 6,800? Probably not this year but 6,000 is a real possibility by calendar year end 2017 with the previous all time high reached and exceeded in late 2018.
A stellar round of half yearly performance results, increased company dividend payments, coupled with a rise in commodity prices over the past 12 months assisted in lifting the sharemarket during the reporting season up until 28th February to a high of 5,863.
According to Managing Director of Bourse Communications and Investment Clock expert, Rod North, triggers likely to send the index higher for the remainder of 2017 and into 2018 include the sustainability of company earnings, potential for increasing dividends for the full year to 30 June 2017 and then the subsequent periods to 31st December 2017 and 30th June 2018.
Mr North says, “Coupled with commodity prices staying around the current levels, a lower exchange rate and a low cash rate of 1.5% to 2% create almost the ideal conditions for many companies to grow their businesses both organically and strategically.”
Where are we? We are still around 17% below the record market high achieved in November 2007 of around 6,800 points.
Mr North notes, “Frustratingly after nearly 10 years, it is certainly taking some time to achieve this in the current cycle. We are now in the tenth year of the market rebuilding process since the index high point was reached.”
So will 2017/18 be the years that we finally hit the ‘Boom Phase’?
It often takes years (five to seven) to get to the Boom Phase of the cycle. Because of the digital age and the power of the information age, a revolving door of country leadership on a world scale, the old norms of a cyclical market have been rewritten for the 21st century.
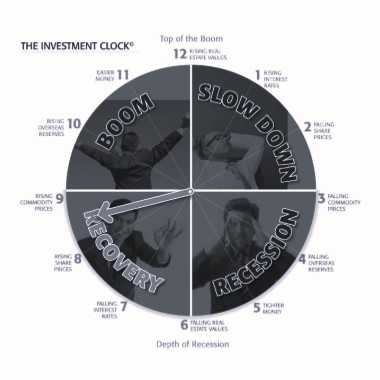
Mr North advises that when we get well into the ‘Boom Phase’, between 11 o’clock and 12 o’clock, all the usual signals are there to tell investors they are on borrowed time. This is a time of maximum optimism, a feeling of real and sometimes imagined wealth, where investors have accumulated significant assets and have an attitude that favourable conditions will continue indefinitely. We are not quite there yet (9 o’clock) but could be just about to enter the early stages of the’ Boom Phase’ that could last for 18 months to 2 years.
We don’t actually reach the Boom Phase on the Investment Clock until we get to 6,000 points on the All Ords and then surpass the all-time market high of 6,800 reached in November 2007.
Mr North says, “I believe the Investment Clock is just at the beginning of 9 o’clock, towards the end of the recovery phase, and creeping towards the start of the boom phase.”

Following a string of good company results and a rise in commodity prices, the future is starting to look brighter, but how can we be sure that it really is time to invest our hard-earned money and how do we know where we are in the investment cycle?
While sharebrokers and analysts might argue about where we are exactly, when looking at the Investment Clock, most will agree that it takes between seven and eleven years for the sharemarket – and the Clock – to run full cycle. As we’ve passed the Recovery Phase through 6 o’clock to 8 o’clock, we should start preparing ourselves for the unpredictability yet rewards that can be delivered during of the Boom Phase. This means that if you’re considering buying shares, you better seek financial advice and assistance to see how you can capitalise on opportunities.
According to Mr North, a great deal of care and analysis needs to be undertaken in selecting appropriate shares to invest in particularly given the changing nature of companies influenced by the power of disruption and the influence of technology in the market.
Mr North notes, “A good example of this will be the consequences of the rumored appearance of Amazon in Australia and the effect this could have on the listed ‘bricks and mortar’ retail companies in Australia. This could be a repeat of the ‘rivers of gold’ that once powered two news icons but then disappeared for News Limited and Fairfax, as the advertising revenue for cars, real estate and job advertisements created new billion dollar companies resulting in a paradigm shift on how consumers engage in this area.”
It has certainly been a frustrating wait for the Boom Phase to get here, but as Mr North claims, “Now could be the time!” We are now in the tenth year of the market rebuilding process since the index high point was reached. Because of the digital age and the power of the information age, the old norms of a cyclical market have been rewritten for the 21st century. This next Phase is often characterised as a time of maximum optimism, a feeling of real and sometimes imagined wealth, where investors have accumulated significant assets and have an attitude that favourable conditions will continue indefinitely. We need to be very careful as this Phase matures.
At 9 o’clock the seeds of the recovery are now well and truly sown and as Mr North notes, with the Presidency of Donald Trump heralding a large rise in the Dow Jones since his election, share prices have started to show the telltale Boom signs of gradual to rapid increase, with a hike in commodity prices and overseas reserves being rebuilt.
This entering of the Boom Phase means that we have moved beyond the difficulties of 8 o’clock, where companies were forced to become leaner and increase productivity. These measures and the slowly improving economy were part of this cyclical process and have translated into increased company profits, which worked, as expected, to gradually stimulate the recovery of share prices.
Mr North wisely advises, “While good profits can be generated from acquiring shares before they list on the sharemarket, it should be remembered that the sharemarket is a volatile and uncertain beast. Booms come and investors can accumulate great wealth. Booms disappear and can quickly wipe-out investment value. Keep your head while all those around you lose theirs.”